Now that your data collection system is up and running, all you have to do is check out your Google Analytics page every so often. Here are some important metrics to be familiar with:
Audience Overview

Users – The number of unique users (identified by their IP addresses) who visited your website. Think of a user as an individual person who visited the site.
Sessions – The interactions (pageviews, clicks, etc) that happen on your website within a given time span (usually 30 minutes), per user. It’s like going to the mall – in one visit, you’d stop by different stores, catch a movie, get a bite to get, and more.
Pageviews – The total number of pages viewed by your audience within the specified time frame.
Session duration – The average time that a user stays on a page.
Bounce rate – The percentage of users who leave (exit) your website without viewing other pages. The lower the number, the better
While it is common to use Pageviews to denote web traffic, it is actually a combination of users, sessions and pageviews. There are different strategies to get more users, more sessions and more pageviews.
Do you see the squiggly lines under each metric? These are sparklines that tells you how the metric is doing over time.
Demographics Overview

Age & Gender – Your audience’s age group and gender. You might tweak your language or design-related decisions based on this info
Mobile Overview

Devices Category – How does your audience interact with your website? If the majority prefers accessing it via mobile devices, then you have to make sure your website is mobile-optimized.
Acquisition Channels
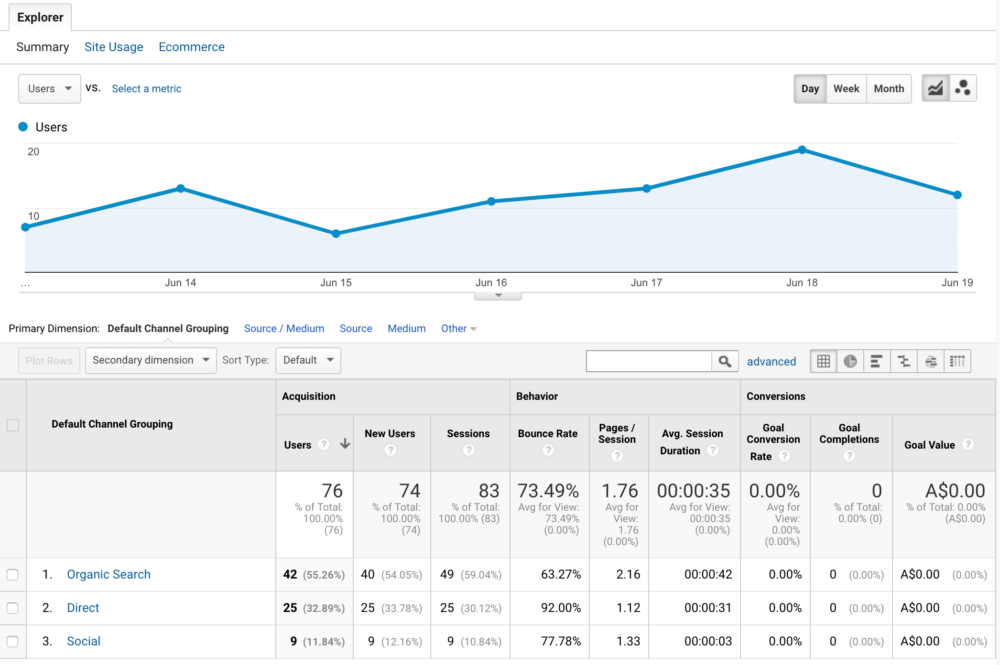
Acquisition – Where your audience comes from and its correlation with behavior and conversion
Protip: Google Analytics Insights

Google Analytics has a feature called Analytics Intelligence that helps you interpret and understand your data. You can access it by clicking the Insights button in the top right of the screen.
Analytics Insight will notify you about areas for improvement. For example, it may tell you which of your landing pages are loading slowly, which affects user experience and subsequently, traffic.
If this is all new to you, don’t worry too much. Explore the reports and read the Insights. Soon you’ll get more comfortable with Google Analytics and will be able to make better decisions based on hard data.
To learn more about analyzing reports and setting up goals for campaign tracking, head over to the Analytics Academy to see (FREE) courses offered by Google.